
Global funding for family planning is a stool with three legs: domestic government expenditures, international donor contributions, and consumer spending.
Domestic government spending is the mainstay of a country’s family planning program, providing a budgeted flow of funds for services and staff. Funding from international donors provides the fiscal headroom to expand and strengthen the program, secure the supply of commodities, and incorporate relatively high-priced contraceptives into the method mix. Out-of-pocket spending by consumers — for commodities and services purchased in the private sector or service fees in the public sector — facilitates customer segmentation and a total market approach to family planning.
The importance of each “leg” varies significantly across countries. Family planning programs in some countries are very donor dependent, while others are largely funded by the government and consumers. But from a global perspective, all three types of funding are essential for progress in strengthening and expanding rights-based family planning.
FP2030 builds on the efforts of the FP2020 partnership to track these resource flows across the family planning sector. We are joined in this work by several other partners who also track aspects of SRH spending — not just family planning — within the larger universe of low-income, lower-middle income, and upper-middle income countries. No one partner has the resources to map the entire landscape; together our reports provide a composite look at all the available data.
FP2030 is one of several data partners who track resource flows and expenditures for sexual and reproductive health. The reports overlaps in scope and compliment each other in focus and depth.
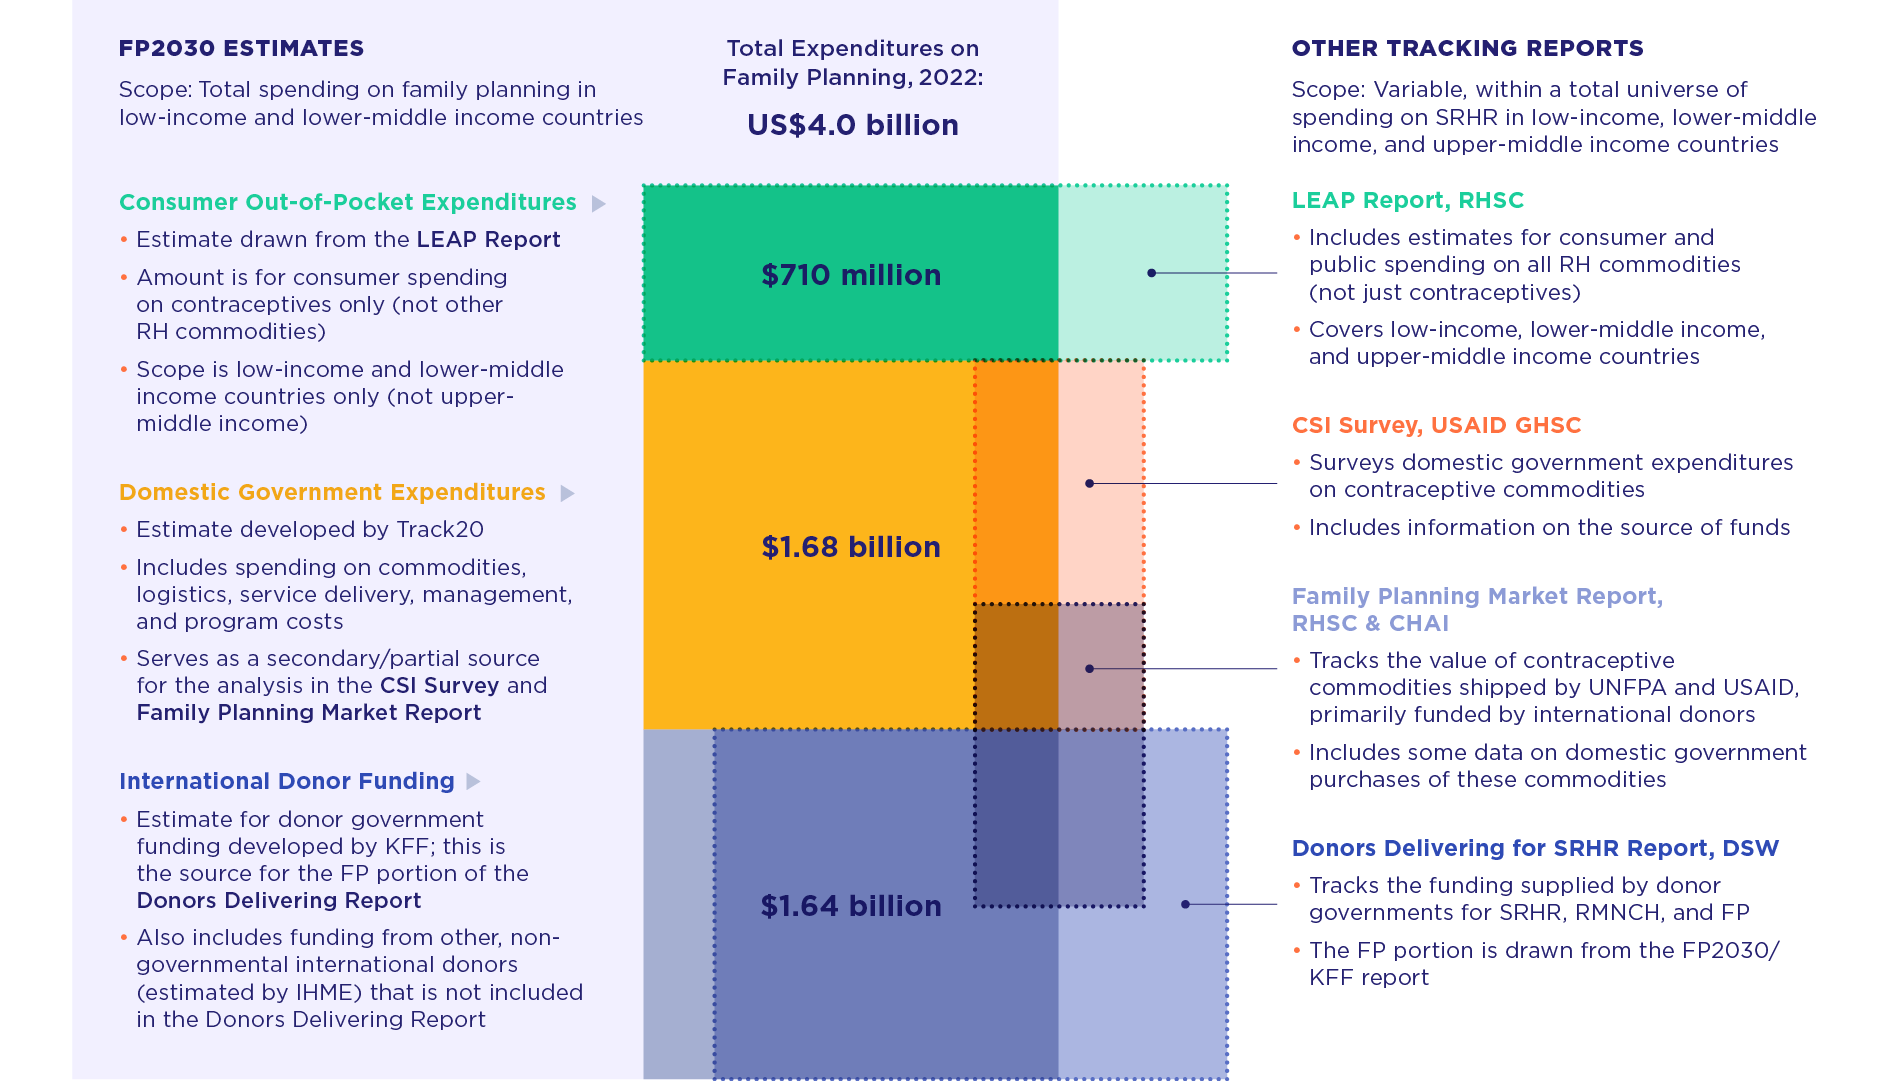
LEAP Report, RHSC: https://leap.rhsupplies.org/
CSI Survey, USAID GHSC: https://www.ghsupplychain.org/csi-dashboard/2021
Family Planning Market Report, RHSC & CHAI: https://www.rhsupplies.org/uploads/tx_rhscpublications/Family-Planning-Market-Report.pdf
Donors Delivering for SRHR Report, DSW: https://donorsdelivering.report/
For 2022, FP2030 estimates total expenditures on family planning at US$4.0 billion across all low-income and lower middle-income countries. International donors contributed an estimated US$1.64 billion (including US$1.35 billion from donor governments), domestic governments an estimated US$1.68 billion, and consumers an estimated US$710 million. (Each of these estimates is explained in more detail in subsections below.)
The domestic government figure is on par with our last two estimates for domestic expenditures: US$1.6 billion in 2019 and US$1.73 billion in 2021. Fluctuations in this total from year to year should not be interpreted as a trend; domestic expenditure estimates are still relatively new and reflect the evolving and ever-sharpening nature of the methodology, as more and more countries report their expenditure data.
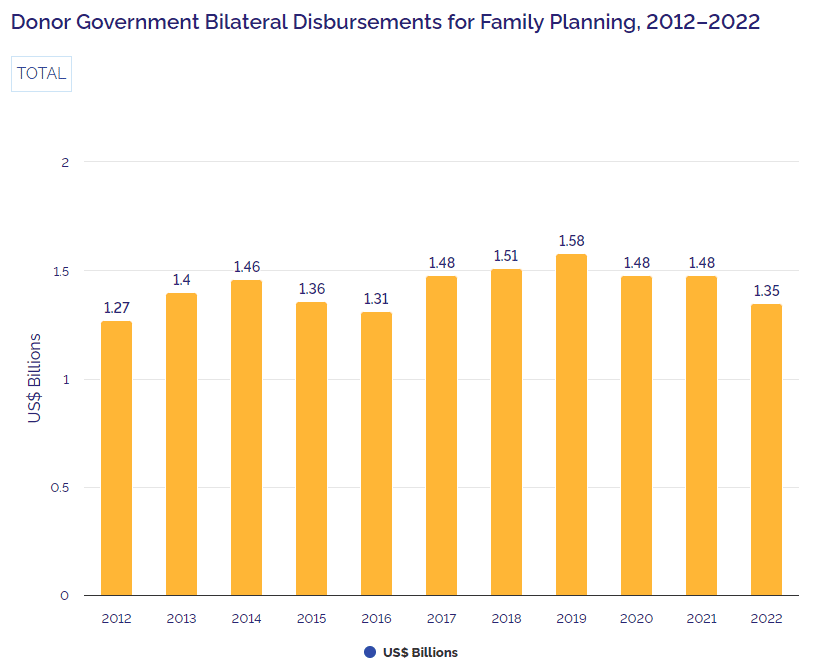
The alarming data point this year is the decline in donor government contributions, which does look like a trend. The Kaiser Family Foundation (KFF) has tracked donor government expenditures every year since 2012 using the same methodology. The estimated total for 2022 is almost 10% below the prior year’s level and almost 15% below the peak level in 2019. Donor governments are now providing a level of funding on par with what they were providing in 2015.
Yet, as noted earlier in this report, the population of women of reproductive age is now 20% larger than it was at the outset of this partnership in 2012.
If donor funding continues to stagnate or shrink, it could imperil the achievement of country goals for family planning as well as the Sustainable Development Goals. Domestic governments, which collectively already shoulder the largest portion of total family planning expenditures, may not be able to meet the shortfall. Consumers in these countries may be forced to spend more money out-of-pocket or forego services entirely. Expensive contraceptive methods that depend on donor support, such as implants, may become less available.
These factors should be borne in mind as countries and their donor partners plan for the future. What level of expenditure is needed to serve a growing population of women who want access to a wide range of contraceptive methods, both today and in years to come? What level is needed to expand family planning services to those who have been left behind? Countries, donors, and the global family planning community will need to think in terms of long-range funding strategies that make the most of domestic resources as well as donor contributions.
We estimate that international donors spent US$1.64 billion on family planning in 2022. This includes contributions from donor governments as well as NGOs and private foundations. The lion’s share (US$1.35 billion) is from donor governments, as reported by the Kaiser Family Foundation (KFF); see below for their analysis. Other international donors (NGOs and private foundations) contributed an estimated US$360 million in 2022; see below for further discussion.

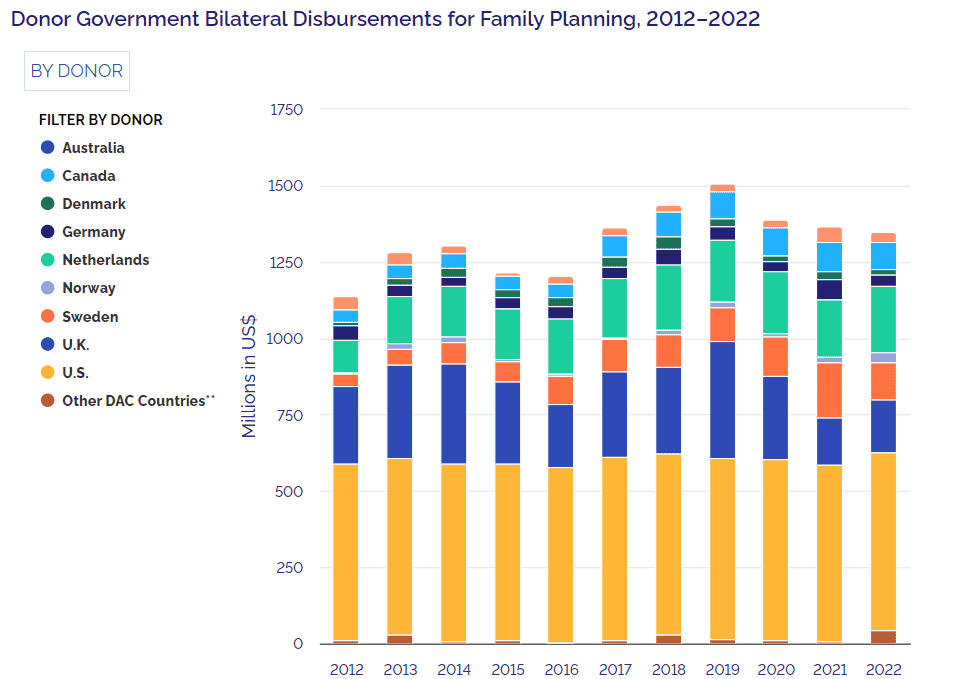
KFF has been collecting and analyzing donor government funding for family planning (FP) on an annual basis since the London Summit on Family Planning in 2012. This year’s analysis assesses funding in 2022 as well as trends over time. Totals presented include both bilateral funding specifically for FP, as well as the estimated share of donor government contributions to UNFPA’s core resources that are used for FP. It is based on analysis of data from the 32 donor government members of the Organisation for Economic Co-operation and Development (OECD) Development Assistance Committee (DAC) in 2022 who had reported Official Development Assistance (ODA). Data were collected directly from 9 of these governments, who account for 97% of all bilateral donor government funding for family planning; data for the remaining donors were obtained from the OECD Creditor Reporting System (CRS).
COUNTRY
2012
2013
2014
2015
2016
2017
2018
2019
2020
2021
2022
Australia
Canada
Denmark
Germany
Netherlands
Norway
Sweden
United Kingdom
United States
Other DAC Countries
TOTAL
$46.0
$42.4
$29.2
$14.6
$26.2
$27.5
$23.3
$25.7
$25.0
$49.5
$44.8
$48.6
$50.9
$45.4
$46.0
$72.3
$83.6
$91.2
$96.1
$99.9
$21.3
$27.9
$36.6
$35.6
$35.9
$44.7
$44.0
$32.70
$24.9
$26.5
$51.5
$42.7
$35.9
$38.1
$42.3
$43.6
$55.1
$49.9
$46.9
$70.1
$114.6
$163.5
$172.6
$173.4
$190.4
$207.0
$221.2
$209.1
$208.9
$193.7
$14.4
$33.6
$33.6
$18.7
$14.4
$15.9
$22.4
$25.3
$20.6
$19.7
$53.6
$62.7
$83.3
$76.9
$103.5
$126.4
$119.4
$122.8
$141.0
$185.5
$258.8
$311.1
$333.8
$275.8
$209.5
$287.0
$288.3
$387.4
$275.6
$207.7
$585.5
$584.7
$585.1
$585.0
$582.5
$600.5
$592.5
$592.5
$592.5
$579.2
$79.1
$87.3
$102.3
$96.7
$57.4
$50.3
$59.1
$38.4
$49.6
$47.4
$1,269.5
$1,404.8
$1,463.2
$1,360.2
$1,308.2
$1,475.0
$1,508.9
$1,575.0
$1,481.1
$1,479.3
$36.0
$88.3
$18.1
$36.6
$217.4
$31.4
$121.3
$174.7
$582.9
$43.2
$1,349.9
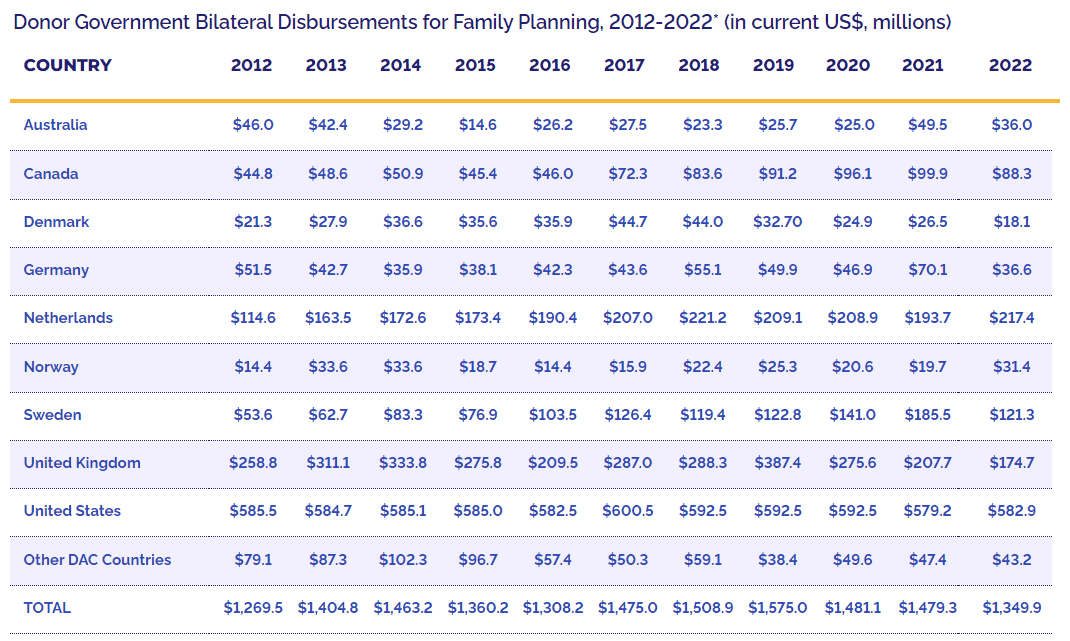
The US continued to be the largest donor to family planning in 2022, accounting for 43% (US$582.9 million) of total funding from governments, followed by the Netherlands (US$217.4 million, 16%), the U.K. (US$174.7 million, 13%), Sweden (US$121.3 million, 9%) and Canada (US$88.3 million, 7%).
The vast majority of family planning funding is provided bilaterally (US$1.3 billion or 96%). The remainder — US$50 million (4%) — is in the form of multilateral contributions to UNFPA’s core resources, adjusted for an estimated FP share.
While the bulk of donor funding for family planning is captured by the KFF estimates, some contributions by private foundations and NGOs lie outside these reporting channels. The Institute for Health Metrics and Evaluation (IHME) collects data from several sources, including the OECD-DAC CRS, World Bank, regional development banks, USAID-financed NGOs, and UN agencies, to identify health spending by international donors.22
IHME estimates that in 2022, foundations and NGOs provided US$360 million in funding for family planning that is not included in the KFF estimate. It is important to note, however, that this still does not provide a complete picture of donor funding. Anonymous donors are not included in these estimates, nor is it possible to ascertain how much funding for family planning is flowing through the Global Financing Facility. These are areas where additional methods of estimation may need to be developed.
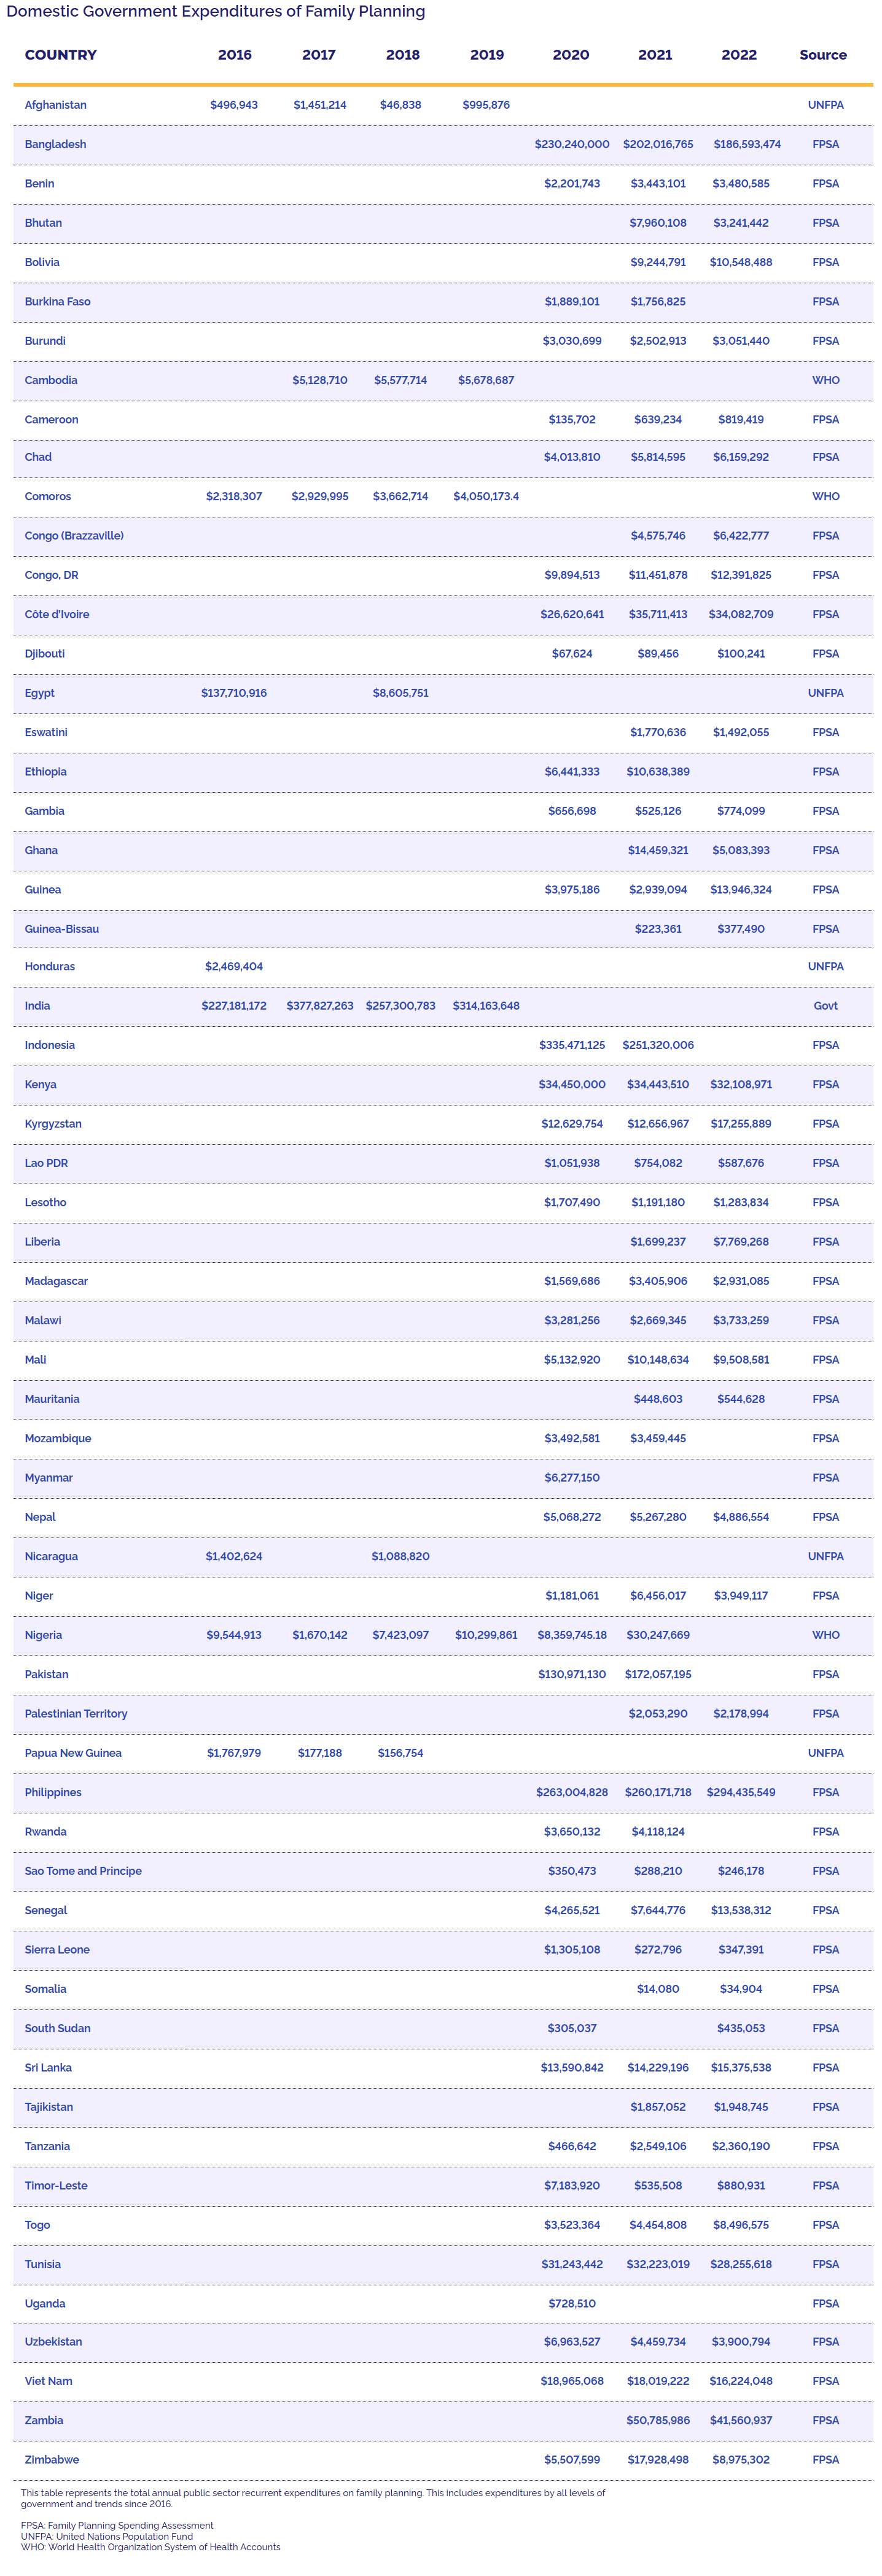
Domestic governments spent an estimated US$1.68 billion on family planning in 2022. Domestic expenditures are defined as all government expenditures that support family planning, including commodity purchases, demand creation campaigns, investments in training and research, and service delivery.
This is our sixth year of reporting domestic expenditures at the country level, with the number of countries for which estimates are available increasing each year. This year’s table includes estimates for 61 low- and lower-middle income countries, amounting to US$1.6 billion in spending. The largest amounts are reported by populous countries in Asia that fund much of their own program. India, the Philippines, Indonesia, Bangladesh and Pakistan together account for about 76% of the total. Government expenditure per modern method user ranges from nearly zero to US$50, with an average of US$5 per user. Reporting countries account for 95% of modern method users in all low-income and lower middle-income countries. Adjusting for the missing countries raises the estimated domestic government expenditures to US$1.68 billion.
The latest estimate of expenditures is 3% lower than reported last year. This should not be interpreted as a trend, however, since the data set has changed each year and there are large fluctuations in country spending. The new estimate adds four countries (Cambodia, Eswatini, Palestine, and Tunisia) totaling nearly US$39 million, but there were large declines in spending in Bangladesh (from US$230 million to US$187 million) and Indonesia (from US$355 million to US$251 million) that were only partially offset by increases in Pakistan (US$130 million to US$171 million) and the Philippines (US$260 million to US$294 million).
COUNTRY
2016
2017
2018
2019
2020
2021
2022
Source
Afghanistan
Bangladesh
Benin
Bhutan
Bolivia
Burkina Faso
Burundi
Cambodia
Cameroon
Chad
Comoros
Congo (Brazzaville)
Congo, DR
Côte d’Ivoire
Djibouti
Egypt
Eswatini
Ethiopia
Gambia
Ghana
Guinea
Guinea-Bissau
Honduras
India
Indonesia
Kenya
Kyrgyzstan
Lao PDR
Lesotho
Liberia
Madagascar
Malawi
Mali
Mauritania
Mozambique
Myanmar
Nepal
Nicaragua
Niger
Nigeria
Pakistan
Palestinian Territory
Papua New Guinea
Philippines
Rwanda
Sao Tome and Principe
Senegal
Sierra Leone
Somalia
South Sudan
Sri Lanka
Tajikistan
Tanzania
Timor-Leste
Togo
Tunisia
Uganda
Uzbekistan
Viet Nam
Zambia
Zimbabwe
$496,943
$1,451,214
$46,838
$995,876
UNFPA
$230,240,000
$202,016,765
$186,593,474
FPSA
$2,201,743
$3,443,101
$3,480,585
FPSA
$7,960,108
$3,241,442
FPSA
$9,244,791
$10,548,488
FPSA
$1,889,101
$1,756,825
FPSA
$3,030,699
$2,502,913
$3,051,440
FPSA
$5,128,710
$5,577,714
$5,678,687
WHO
$135,702
$639,234
$819,419
FPSA
$4,013,810
$5,814,595
$6,159,292
FPSA
$2,318,307
$2,929,995
$3,662,714
$4,050,173.4
WHO
$4,575,746
$6,422,777
FPSA
$9,894,513
$11,451,878
$12,391,825
FPSA
$26,620,641
$35,711,413
$34,082,709
FPSA
$67,624
$89,456
$100,241
FPSA
$137,710,916
$8,605,751
UNFPA
$1,770,636
$1,492,055
FPSA
$6,441,333
$10,638,389
FPSA
$656,698
$525,126
$774,099
FPSA
$14,459,321
$5,083,393
FPSA
$3,975,186
$2,939,094
$13,946,324
FPSA
$223,361
$377,490
FPSA
$2,469,404
UNFPA
$227,181,172
$377,827,263
$257,300,783
$314,163,648
Govt
$335,471,125
$251,320,006
FPSA
$34,450,000
$34,443,510
$32,108,971
FPSA
$12,629,754
$12,656,967
$17,255,889
FPSA
$1,051,938
$754,082
$587,676
FPSA
$1,707,490
$1,191,180
$1,283,834
FPSA
$1,699,237
$7,769,268
FPSA
$1,569,686
$3,405,906
$2,931,085
FPSA
$3,281,256
$2,669,345
$3,733,259
FPSA
$5,132,920
$10,148,634
$9,508,581
FPSA
$448,603
$544,628
FPSA
$3,492,581
$3,459,445
FPSA
$6,277,150
FPSA
$5,068,272
$5,267,280
$4,886,554
FPSA
$1,402,624
$1,088,820
UNFPA
$1,181,061
$6,456,017
$3,949,117
FPSA
$9,544,913
$1,670,142
$7,423,097
$10,299,861
$8,359,745.18
$30,247,669
WHO
$130,971,130
$172,057,195
FPSA
$2,053,290
$2,178,994
FPSA
$1,767,979
$177,188
$156,754
UNFPA
$263,004,828
$260,171,718
$294,435,549
FPSA
$3,650,132
$4,118,124
FPSA
$350,473
$288,210
$246,178
FPSA
$4,265,521
$7,644,776
$13,538,312
FPSA
$1,305,108
$272,796
$347,391
FPSA
$14,080
$34,904
FPSA
$305,037
$435,053
FPSA
$13,590,842
$14,229,196
$15,375,538
FPSA
$1,857,052
$1,948,745
FPSA
$466,642
$2,549,106
$2,360,190
FPSA
$7,183,920
$535,508
$880,931
FPSA
$3,523,364
$4,454,808
$8,496,575
FPSA
$31,243,442
$32,223,019
$28,255,618
FPSA
$728,510
FPSA
$6,963,527
$4,459,734
$3,900,794
FPSA
$18,965,068
$18,019,222
$16,224,048
FPSA
$50,785,986
$41,560,937
FPSA
$5,507,599
$17,928,498
$8,975,302
FPSA
This table represents the total annual public sector recurrent expenditures on family planning. This includes expenditures by all levels of government and trends since 2016.
FPSA: Family Planning Spending Assessment
UNFPA: United Nations Population Fund
WHO: World Health Organization System of Health Accounts
In many countries government spending on family planning is decentralized, with some amounts coming from national budgets and some from sub-national government bodies. Thus there is interest in understanding how decentralized government entities—such as provinces, states, local government administrations/units and municipal governments, districts, and even facilities—might increase their funding for health programs and for family planning. Since 2017, Track20 has attempted to estimate the contribution of decentralized funding to total domestic funding as part of its Family Planning Spending Assessments (FPSAs). In that year Kenya reported decentralized funding from its 47 counties for 2014-2015.
Table 8 lists the most recent data (from 2021 and 2022) for countries whose FPSA showed decentralized funding. The results indicate various levels of decentralized funding compared to central government funding. In Pakistan the ratio of decentralized funding is very high, with 98% of total FP expenditures coming from the provinces. In Kenya, the counties accounted for 85% of total family planning expenditures. The Philippines data show that decentralized funding amounted to 68% of total family planning expenditures, with the majority coming from Local Government Entities.
Total from all Financing Sources
Total Central Government
Total Decentralized
Percent Decentralized
Bolivia 2022
$10,548,488
$8,372,523
$2,175,965
21%
Indonesia 2020
$355,371,125
$352,986,737
$2,469,294
1%
Kenya 2021
$32,108,972
$4,937,874
$27,171,098
85%
Mali 2021
$10,148,634
$10,134,255
$14,378
0.1%
Nepal 2021
$5,267,280
$4,968,612
$298,668
6%
Pakistan 2021
$172,057,195
$4,800,274
$167,256,921
97%
Philippines
$294,435,549
$64,775,821
$229,659,728
78%
Somalia 2022
$34,904
$17,584
$17,320
50%
Tanzania 2022
$2,360,190
$1,948,607
$411,583
16%
Uzbekistan 2022
$3,900,794
$3,465,000
$435,280
11%
Vietnam 2022
$16,224,048
$3,510,864
$12,713,184
78%
While the number of countries showing decentralized funding is relatively small (compared to the yearly average of 42 countries for which FPSAs were conducted in 2021 and 2022), there are at least three factors at work:
Discussions in Francophone West Africa by Track20 staff revealed that many managers did not know if decentralized funding existed in their countries. Track20 is currently working with Nigeria to include the expenditures financed by the 37 Nigerian States.
See the Technical Appendix for methodologies.
Consumers spent an estimated US$710 million on family planning in 2022. This figure is based on the Landscape & Projection of Reproductive Health Supply Needs (LEAP) Report, produced by the Reproductive Health Supplies Coalition and Avenir Health. The LEAP Report estimates out-of-pocket expenditures on contraceptives based on the number of modern method users (from Track20 and the UN Population Division), method mix, price points, and the percentage of users obtaining services from the private sector (from DHS, MICS, and other national surveys).
Family planning totals include bilateral funding as well as an FP-adjusted share of donor government contributions to UNFPA’s core resources. Bilateral funding represents amounts specifically designated by donor governments for family planning as defined by the OECD DAC and includes standalone family planning projects, family planning-specific contributions to multilateral organizations (e.g., contributions to UNFPA Supplies), and, in some cases, projects that include family planning within broader reproductive health activities.
UNFPA’s core resources are meant to be used for both programmatic activities (family planning, population and development, HIV/AIDS, gender, and sexual and reproductive health and rights) as well as operational support. Donor government contributions to UNFPA’s core resources were adjusted to reflect the share of core resources supporting FP activities in a given year based on information from UNFPA. For instance, in 2022 UNFPA reported expenditures totaling US$532 million from core resources, including US$63 million for family planning activities, which results in an estimated 12% of a donor government’s core contribution in 2022 being included in its total funding for FP.23
With some exceptions, data represent “disbursements,” which are defined as the actual release of funds to, or the purchase of goods or services for, a recipient. They were obtained through direct communication with donor governments, analysis of raw primary data, and the OECD CRS. UNFPA funding data were obtained from Executive Board documents and direct communications.
For the US, funding represents final, Congressional appropriations (firm commitments that will be spent), rather than disbursements, which can fluctuate from year-to-year due to the unique nature of the US budget process (unlike most other donors, US foreign assistance funding may be disbursed over a multi-year period).
In some cases it is difficult to disaggregate bilateral family planning funding from broader population, reproductive and maternal health totals, and the two are sometimes represented as integrated totals. In addition, family-planning-related activities funded in the context of other official development assistance sectors (e.g., humanitarian assistance, education, civil society) have remained largely unidentified. For the purpose of this analysis, we worked closely with the largest donors to family planning to identify such cross-sectoral family-planning-specific funding where possible (see table notes).
Funding data are collected from donor governments in their currency of origin and converted to US dollars using exchange rate data from the OECD DAC and US Federal Reserve. Exchange rates for 2022 were applied to 2021 totals to assess the effect of currency fluctuations on overall funding levels between 2021-2022. Totals have not been adjusted for inflation. For data in the currency of the donor country, please contact the researchers.
The expenditures reported come from three different sources:
WHO/SHA. WHO has been implementing data collection on health expenditures under the System of Health Accounts (SHA) 2011 for several years as part of a joint effort with the Organization for Economic Co-operation and Development (OECD) and Eurostat. Government approved estimates are published on the WHO Global Health Expenditure Database. These data include directly measured expenditures by year, when available, or estimates based on trends from measurements in previous years.
FPSA (Family Planning Spending Assessment). Track20 collects data on FP expenditures in low- and middle-income countries using a modified version of the National HIV/AIDS Spending Assessment (NASA) that focuses strictly on family planning. These analyses collect information from the main funders and implementing organizations to describe sources and uses of funds. Results are disseminated to governments and other stakeholders. The FPSA methods were first tested in Kenya with 2017 data and have now been extended to 48 countries with estimates of FP expenditures from government.
UNFPA. UNFPA and NIDI (Netherlands Interdisciplinary Demographic Institute) tracked domestic government expenditures for family planning from 2014 to 2019. NIDI worked with national UNFPA offices to engage local consultants to review records and interview government officials. Results were checked for completeness and quality by NIDI. Final results were approved for release by the organizations contributing data and, in most cases, by appropriate government agencies.
PHOTO BY Jonathan Torgovnik/Getty Images/Images of Empowerment